
POTM Blog Issue #13, July 25, 2026
The Pressure Valve
Three issues in a row have been about the house market: the million-over headlines, the buyers who adapt, the list prices built to be beaten. This issue follows the pressure somewhere new. When a house costs $2.1M and sells 24% over asking, the demand does not disappear. It escapes into the nearest thing that still feels like a house, and the data now shows exactly where.
By Paulo Serna, Level Up Group · Compass · Published July 25, 2026
Three issues in a row have been about houses. June's million-over headlines turned out to be a narrow, cash-heavy trophy story. The buyers who kept losing those bidding wars turned out not to leave, but to adapt, one neighborhood over. And the overbid percentage itself turned out to measure pricing strategy as much as demand. This issue asks the question that naturally comes next: while houses sell 24% over asking in eleven days, what is happening to everything that is not a house? The answer is that the pressure found a valve. It is escaping into the condos and TICs that live most like houses, and the data now shows it clearly.
The number that hides the story
Read the citywide number and you would see calm. The median San Francisco condominium sold just 1.8% over asking this spring. Against the last decade, though, even that quiet number is news: it is the strongest condo spring since 2018. From 2020 through 2025, six straight springs, the typical condo never sold more than 1.5% over asking. And two further details give the calm away. First, the share of condos selling over asking at all jumped from 39% a year ago to 58% now. Second, the median condo now sells in 14 days, half of last year's 27 and the fastest condo spring since 2019. A market where most homes beat their list price in two weeks is not calm. It is a market where the average is hiding a split.
Ten springs of context
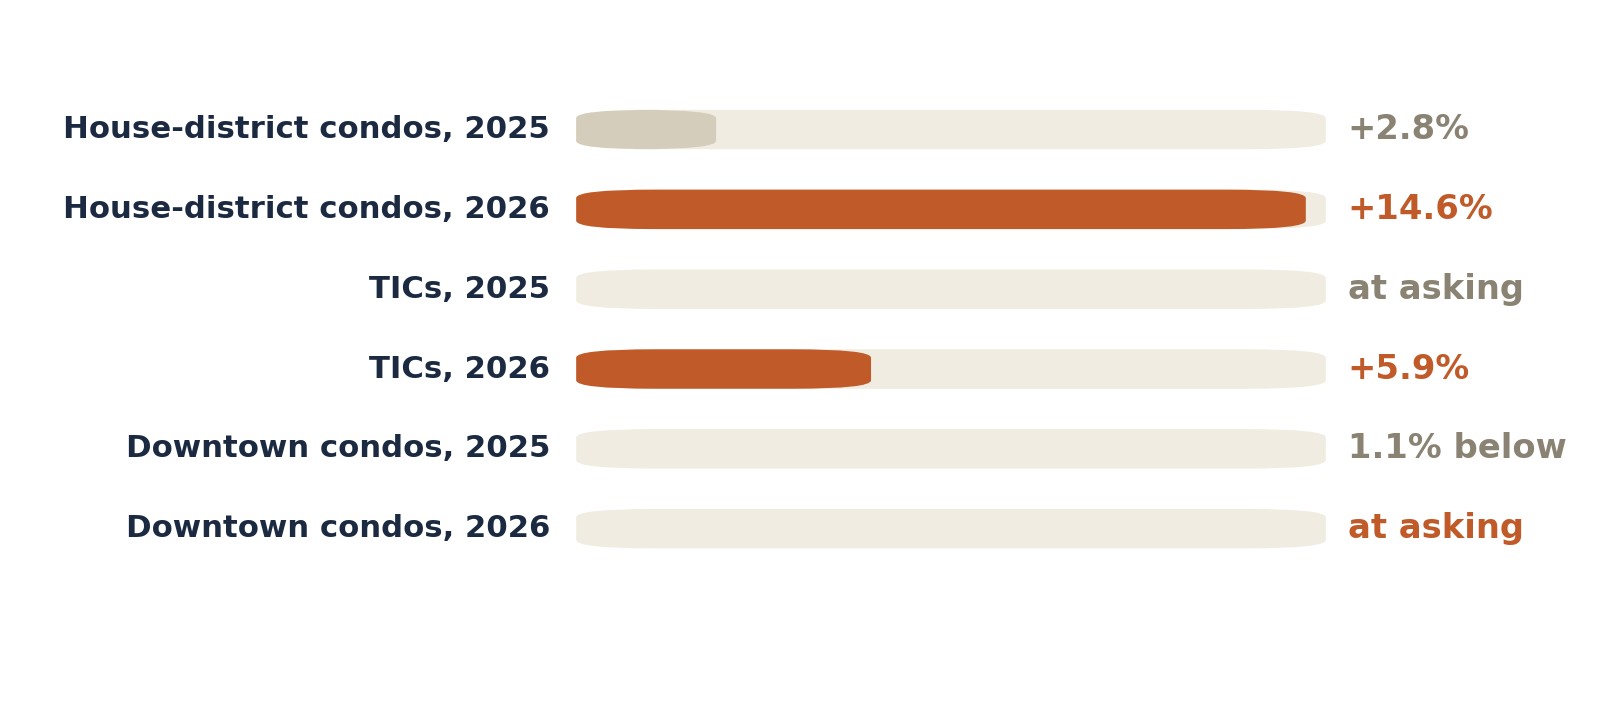
Because every figure in this issue compares the same March-through-late-July window, the same ten-year lens works for all of them, and it is the lens that makes 2026 legible. In the 2016 to 2019 market, house-district condos routinely sold 9 to 14% over asking and TICs touched 9% over in 2018. Then came the long condo winter: from 2020 through 2025, condos citywide sold at asking, TICs sold at asking for six straight years, and the downtown corridor spent 2023 through 2025 selling about 1% below it. What this spring did is not a small wobble off that baseline. House-like condos did not just wake up, they cleared their 2018-19 peak. TICs posted their strongest spring in eight years. The corridor climbed back to par for the first time since 2022. Each lane is breaking out of its own multi-year pattern, at the same time, in the same direction: toward the behavior of the house market next door. The full decade table is at the end of this section.
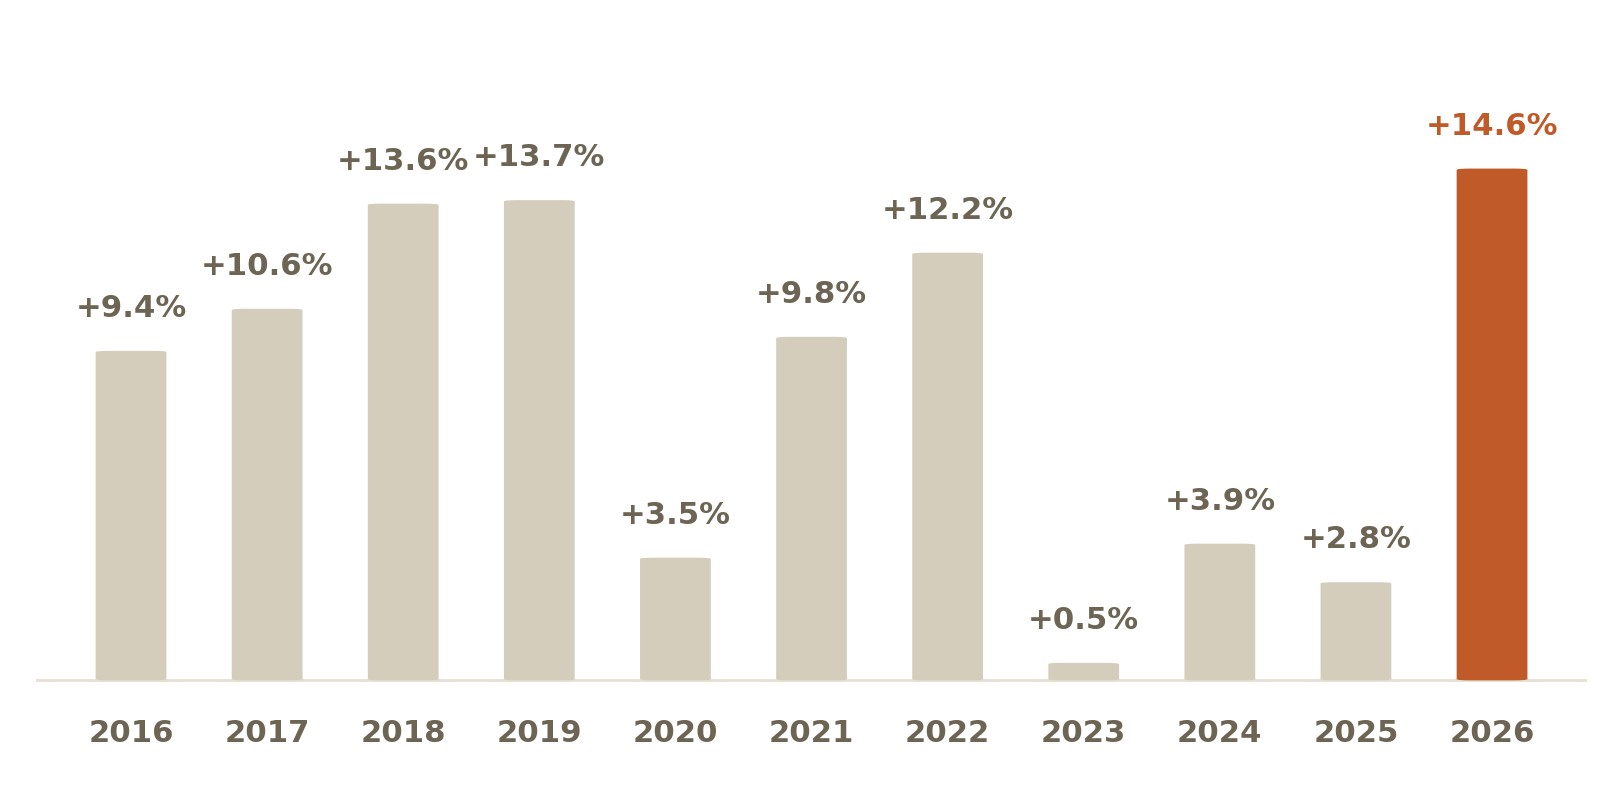
The decade table: typical margin over asking by lane, springs 2016 to 2026
| Spring | Houses | Condos | House-district condos | TICs | Corridor |
|---|---|---|---|---|---|
| 2016 | +10.3% | +2.9% | +9.4% | +2.8% | +0.9% |
| 2017 | +13.8% | +2.2% | +10.6% | +4.0% | 0% |
| 2018 | +17.5% | +4.7% | +13.6% | +9.0% | +1.3% |
| 2019 | +11.6% | +2.7% | +13.7% | +2.2% | +0.5% |
| 2020 | +4.1% | 0% | +3.5% | 0% | 0% |
| 2021 | +13.8% | +0.1% | +9.8% | +0.1% | 0% |
| 2022 | +17.4% | +1.5% | +12.2% | +0.1% | 0% |
| 2023 | +5.3% | 0% | +0.5% | 0% | -1.2% |
| 2024 | +10.1% | 0% | +3.9% | 0% | -0.7% |
| 2025 | +10.8% | 0% | +2.8% | 0% | -1.1% |
| 2026 | +23.8% | +1.8% | +14.6% | +5.9% | 0% |
Typical margin over asking: median sale price relative to list, closed sales March 1 to July 24 of each year. 0% means selling right at asking; negative means below it. Houses citywide; condos citywide; house-district condos are 2 to 3 bedroom condos in Districts 1, 2, 4, 5; corridor is District 8 and 9 condos. San Francisco MLS via POTM Command.
The more it lives like a house, the more it trades like one
Split the condo market by what the home actually is, and the pattern is unmistakable. Take the two and three bedroom condos in the districts where the house frenzy lives, the Richmond, the Sunset, the west side, and the Noe-to-Haight belt. These are the flats with a garage, a yard share, maybe a view line, the homes a priced-out house buyer tours next. This spring they sold a median 14.6% over asking, up from 2.8% over in the same window last year, with 84% selling over asking in a median 12 days. That is nearly a twelve point jump in one year, the largest move of any condo segment in the city, and it is a ten-year high for the lane. The previous peak was 13.6 to 13.7% over in the springs of 2018 and 2019, back when this market last ran hot. This lane is not returning to form. It is past it.
The neighborhood cuts agree. District 5 condos, the Noe Valley, Castro, and Haight flats, sold 15.9% over asking, up almost eleven points. Even District 7, Pacific Heights and the Marina, where condos sold exactly at asking a year ago, is now 9.4% over, and nearly half of those sales closed in cash. Issue #11 tracked buyers substituting one neighborhood for another inside the house market. This is the same behavior, one ring further out: substituting across property types while holding on to the way they want to live.
By the numbers
| Segment | Median price | Typical sale vs asking | Share sold over asking | Median days | Sales |
|---|---|---|---|---|---|
| Houses, citywide | $2.12M | +23.8% | 86% | 11 | 1,025 |
| House-district condos, 2-3BR | $1.60M | +14.6% | 84% | 12 | 186 |
| District 5 condos (Noe, Castro, Haight) | $1.60M | +15.9% | 83% | 13 | 161 |
| District 7 condos (Pacific Heights, Marina) | $1.90M | +9.4% | 76% | 11 | 141 |
| Condos, citywide | $1.30M | +1.8% | 58% | 14 | 1,078 |
| Tenancy-in-common, citywide | $1.30M | +5.9% | 65% | 16 | 127 |
| District 8 condos (downtown, Nob Hill) | $1.04M | at asking | 49% | 20 | 194 |
| District 9 condos (SoMa, Mission Bay) | $1.19M | at asking | 43% | 19 | 376 |
The TIC shift
The sharpest turn belongs to the market's least famous corner. A tenancy in common, a TIC, is a home where you own a share of the building with the exclusive right to your unit, San Francisco's long-standing workaround for buyers who need house-adjacent space at a condo-adjacent price. TICs have traded at their asking price for years, partly because their financing is specialized and their buyer pool thinner. Not this spring. TICs sold a median 5.9% over asking, with 65% selling over, in 16 days, against right at asking and 36 days in the same window last year. The history makes the break visible: TICs sold at asking for six consecutive springs, 2020 through 2025, and had not sold more than 5% over since 2018. Their 16-day market time is the fastest spring in the full ten years of this data; even in the hot 2018 spring they took 20 days. The honest caveat: this is 127 sales, a directional sample, not a robust one. But the shift has now held for two straight quarters, and it points the same direction as everything else in this issue. If you are considering the lane, the tradeoffs are real and specific; Paulo’s condo versus TIC guide walks through them.
Half the wait
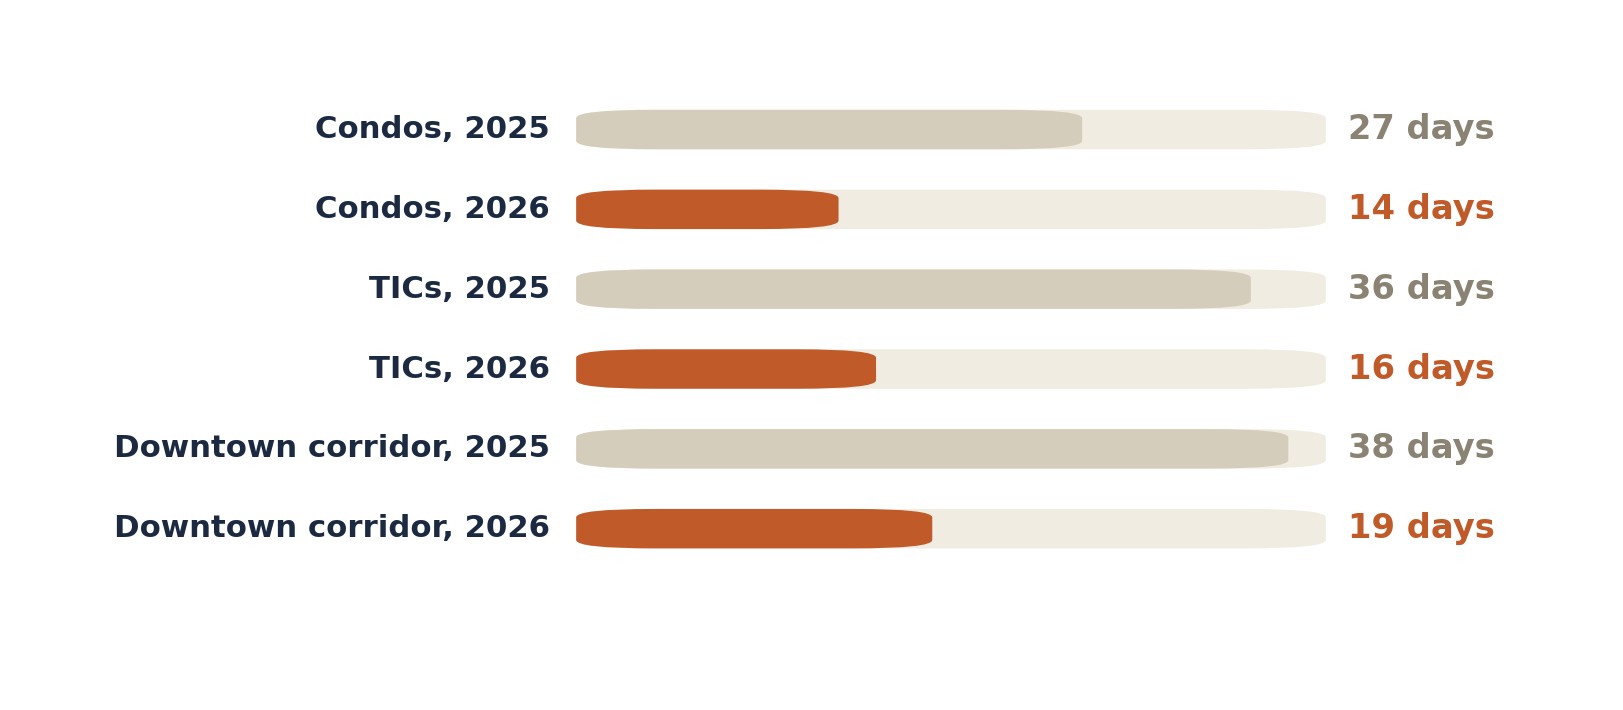
Speed is the change every lane shares. Condos citywide, 27 days to 14. TICs, 36 to 16. Even the downtown corridor, the slowest lane in the city, went from 38 days to 19. For scale: condos have not moved this fast in a spring since 2019, and had spent 2023 through 2025 at a sluggish 27 to 29 days, the slowest stretch of the decade. One nuance keeps this honest: the condos currently sitting on the market show a median 30 days, because what is priced right sells in two weeks and what is not sits. Speed rewards honest pricing now more than at any point in the last several years.
The holdout, on a clock
Then there is the lane this scoreboard has tracked since Issue #1: the towers of District 8 and 9, downtown, SoMa, Mission Bay, the condos closest to the new AI offices. On price, the corridor looks unchanged, still selling right at asking, still the only major lane in San Francisco where the list price is the sale price and a financed buyer can negotiate. But even here the decade adds a wrinkle the single year hides: the corridor sold below asking for three straight springs, by roughly 1%, from 2023 through 2025. Returning to par is not nothing. It is the first time since 2022 that a corridor seller has not had to concede off asking. The AI capital arrived; the AI commute, at least in these prices, still has not. The floor under them, though, has firmed.
But the clock changed. Corridor market time fell from 38 days to 19, and the share of corridor condos selling over asking roughly doubled, from the low twenties to the mid forties. A year ago the corridor was slow and soft. Now it is fast and flat, which is a different market. Prices have not moved yet; the time you have to decide has. The negotiating window is still open, and it is narrowing in the dimension nobody watches: speed.
Condos that live like houses
+14.6%
over asking, $1.60M median
2-3BR in the house districts; 84% sold over asking, in 12 days
The downtown towers
0%
over asking, right at the list price
the last calm price lane, now moving in 19 days instead of 38
What to do with this
If you are buying in the house-like condo lane, in the Richmond, the Sunset, Noe, the Castro, or the Haight, the practical read is the one house buyers learned two years ago: budget from what comparable homes closed at, not from the list price, and expect company. A list price of $1.4M in this lane now behaves the way a house list price does, as a starting position. If the downtown towers fit the way you live, you hold the city's last real negotiating leverage, and the data says to use it sooner rather than later. And if you are weighing a TIC, the discount for complexity is still real, but it is no longer a sleepy corner; go in with the financing understood and a lender who actually writes fractional loans.
If you are selling a house-like condo or a TIC, you have more pricing power this season than the citywide condo headline suggests, and probably more than your neighbors assume. That power rewards precision, not aggression: the homes selling 15% over asking are the ones prepared and priced to their honest comparable number, letting the deep end of the buyer pool do the rest. If you are selling downtown, price to the building's actual closed sales and lean on the one thing that changed, speed, because a well-priced corridor condo no longer needs six weeks to find its buyer.
The honest caveats
The windows are season-matched, March through late July of each year, so spring is compared with spring. These are medians, and any one building or block can run hotter or cooler. The TIC sample, 127 sales, is directional. Two different over-asking figures appear in this issue, and they are worth keeping apart: the typical margin a home sells over its asking price, and the share of homes that sold over asking at all. And as Issue #12 laid out, the margin over asking always mixes pricing strategy with demand. That cuts one way here: condos and TICs are rarely listed low on purpose, so when their margins rise, the move reflects real competition more directly than the same number would on a house. Samples for every other segment cited are Strong.
The story of 2026 so far is not that San Francisco houses got expensive. It is that the demand behind them is deep enough to reprice the next thing, and then the next. The pressure valve is open, and it is pointed at the homes that live most like houses. If you own one, are shopping for one, or are weighing the one lane still at its asking price, that is exactly the conversation the team is here for.
AI Corridor Scoreboard
One reading per issue on the city's softest segment, the condos near the new AI offices, so you can watch the turn as it happens.
| Issue | Date | Reading | Call |
|---|---|---|---|
| #01 | Jun 7, 2026 | Soft. Only 37 to 43% of SoMa, Mission Bay, and downtown condos sold over asking. | Clearest buyer opportunity in the city. |
| #02 | Jun 10, 2026 | Turning at the edges. Citywide condos hit 101.4% of list in May; inventory fell to 584 from 905. The corridor towers remain the soft end. | Window narrowing, not closed. |
| #03 | Jun 13, 2026 | Still the bottom of the overbid table. Corridor sale-to-list at about 98 to 99% versus 103.6% citywide, trailing year. | Opportunity intact for negotiators. |
| #04 | Jun 17, 2026 | Still the soft floor while houses raced ahead. Corridor near 98 to 99% of list versus 103.8% citywide and about 123% for single-family in the last 30 days. | Buyer opportunity holds; the gap to houses only widened. |
| #05 | Jun 21, 2026 | Cash, not heat. Corridor condos carry heavier cash than the citywide condo average, about 42% versus 37%, yet still sell near 98.7% of list with only about 20% over asking versus 45% citywide. Cash concentrates here; competition does not. | Negotiating room for financed buyers. |
| #06 | Jun 25, 2026 | Still the calm corner while the house middle runs hot. District 9 condos, SoMa, Mission Bay, and South Beach, sold right at list, about 100%, with only 35% over asking on 300 sales, against the $1.5M to $3M house band at 122 to 125% of list. | Buyer opportunity holds where the bidding wars are not. |
| #08 | Jul 5, 2026 | Still the soft floor even as the top books records. District 9 condos, SoMa, Mission Bay, and South Beach, sold near 100% of list with heavy cash and light competition, while $5M+ houses set a decade volume record at about 112% of list on roughly 64% cash. Cash without a crowd here. | Buyer opportunity intact where the crowds are not. |
| #09 | Jul 10, 2026 | Still the soft floor at the halfway mark. District 9 condos, SoMa, Mission Bay, and South Beach, sold near 100% of list with only about 36% over asking on roughly 290 sales this year, while citywide houses ran near 121% of list. The widest lane in the city stays open. | Clearest buyer opportunity holds into the second half. |
| #10 | Jul 14, 2026 | Still soft while the headline is elsewhere. June's million-over-asking story is a west-side and central house market, not the AI-corridor towers. District 9 condos, SoMa, Mission Bay and South Beach, ran about 10% below last year even as volume climbed. Activity returns to the corridor; pricing has not. | Still the clearest buyer opening in the city. |
| #11 | Jul 17, 2026 | Unmoved by the house story. While overbidding ran one tier below the trophy core, the corridor and condo core cleared near asking, and the two flat lanes the field named as spillover candidates, Hayes Valley and Lower Pacific Heights, stayed calm in closed data. | Still the clearest buyer opening in the city. |
| #12 | Jul 21, 2026 | Still the calm corner, and it proves the point. District 9 condos, SoMa, Mission Bay, and South Beach, sold right at list, about 100%, with only 31% over asking on 836 sales, while mid-priced houses cleared 123 to 127% of list. Condos rarely get listed low to start a war, so the overbid never appears. | Buyer leverage holds where the list-low tactic is not used. |
| #13 (this issue) | Jul 25, 2026 | Graduated to the essay. Back at asking for the first time since 2022, after three springs about 1% below it, and the clock changed: median market time fell from 38 days to 19 and the share selling over asking roughly doubled, from the low twenties to the mid forties. Price at par, speed doubled. | Negotiating room intact; the window now narrows in speed, not price. |
- The citywide condo number, 1.8% over asking, hides the real story, and even it is the strongest condo spring since 2018 after six years within 1.5% of asking. The share selling over asking jumped from 39% to 58%, and market time halved from 27 days to 14.
- The more a condo lives like a house, the more it now trades like one. Two to three bedroom condos in the house districts sold a median 14.6% over asking, a ten-year high that clears even their 2018-19 peak, with 84% selling over asking.
- TICs shifted regimes. After six straight springs at asking, they sold about 6% over, their strongest spring since 2018, in 16 days, the fastest in the decade. The sample is modest, 127 sales, but the shift held for two straight quarters.
- The downtown corridor is the holdout, but the decade reframes it: about 1% below asking for three springs, 2023 to 2025, it is back at par for the first time since 2022, market time fell from 38 days to 19, and the share selling over asking roughly doubled. The negotiating window now narrows in speed, not price.
- If you are shopping the house-like condo lane, budget from closed prices, not list. If you are selling one, or a TIC, you have more pricing power than the citywide headline suggests.
Every lane in this issue is live in the market explorer. Switch the property type to condo or TIC and read your own neighborhood.
Methodology and sources
Source: POTM Command governed MLS analytics, closed San Francisco sales in season-matched windows, March 1 to July 24 of each year. The 2026 versus 2025 comparisons use those two windows; the decade series applies the same window to every year 2016 through 2026, drawn from 62,638 deduplicated closed sales in the MLS event history. Figures are medians or rates within each segment. Two different over-asking figures appear in this issue: the typical margin, which is the median sale price relative to asking (a home sold 14.6% over asking closed at 114.6% of its list price), and the share of homes that sold over asking at all, always labeled as a share. House-district condos are 2 to 3 bedroom condominiums in MLS Districts 1, 2, 4, and 5; the downtown corridor is District 8 and 9 condominiums. Sales with a reported sale price above twice the list price are excluded as data-entry errors. Samples are Strong for every segment cited except tenancy-in-common, 127 sales, which is reported as directional. The margin over asking reflects pricing strategy as well as demand; as Issue #12 showed, condos and TICs are rarely listed low on purpose, which makes their rising margins more meaningful, not less. Data deemed reliable but not guaranteed, subject to change, correction, and revision. General information, not legal, tax, or financial advice.

About the author
Paulo Serna
Paulo is a real estate agent with Level Up Group at Compass and the team member who researches and writes each Market Intel issue. He built POTM, the governed MLS data engine behind this blog and the team’s market tools, and he lives and works in San Francisco’s Central Richmond. CA DRE# 02150409. More from Paulo at pauloserna.com.
What does this market mean for your block?
Two homes five blocks apart can carry very different risk. Ask the Level Up Group team how this read applies to your specific situation, no pressure.