
POTM Blog Issue #14, July 29, 2026
The Drought
Four issues in a row described a frenzy: the million-over headlines, the buyers who adapted, the overbid decoder, the pressure valve into condos and TICs. None of them named the cause. Here it is. San Francisco stopped listing homes, and the bidding wars are the arithmetic that follows.
By Paulo Serna, Level Up Group · Compass · Published July 29, 2026
Data source POTM, governed SFAR MLS data
Four issues in a row, this scoreboard has walked the same market from different angles. The million-over headlines in June. The buyers who kept losing and adapted one neighborhood over. The overbid percentage that measures pricing strategy as much as demand. The pressure valve that pushed the frenzy into the condos and TICs that live like houses. Every one of those pieces described what the frenzy looks like. None of them said why it exists. The refreshed data gives a plain answer: there is almost nothing to buy.
Zero point seven
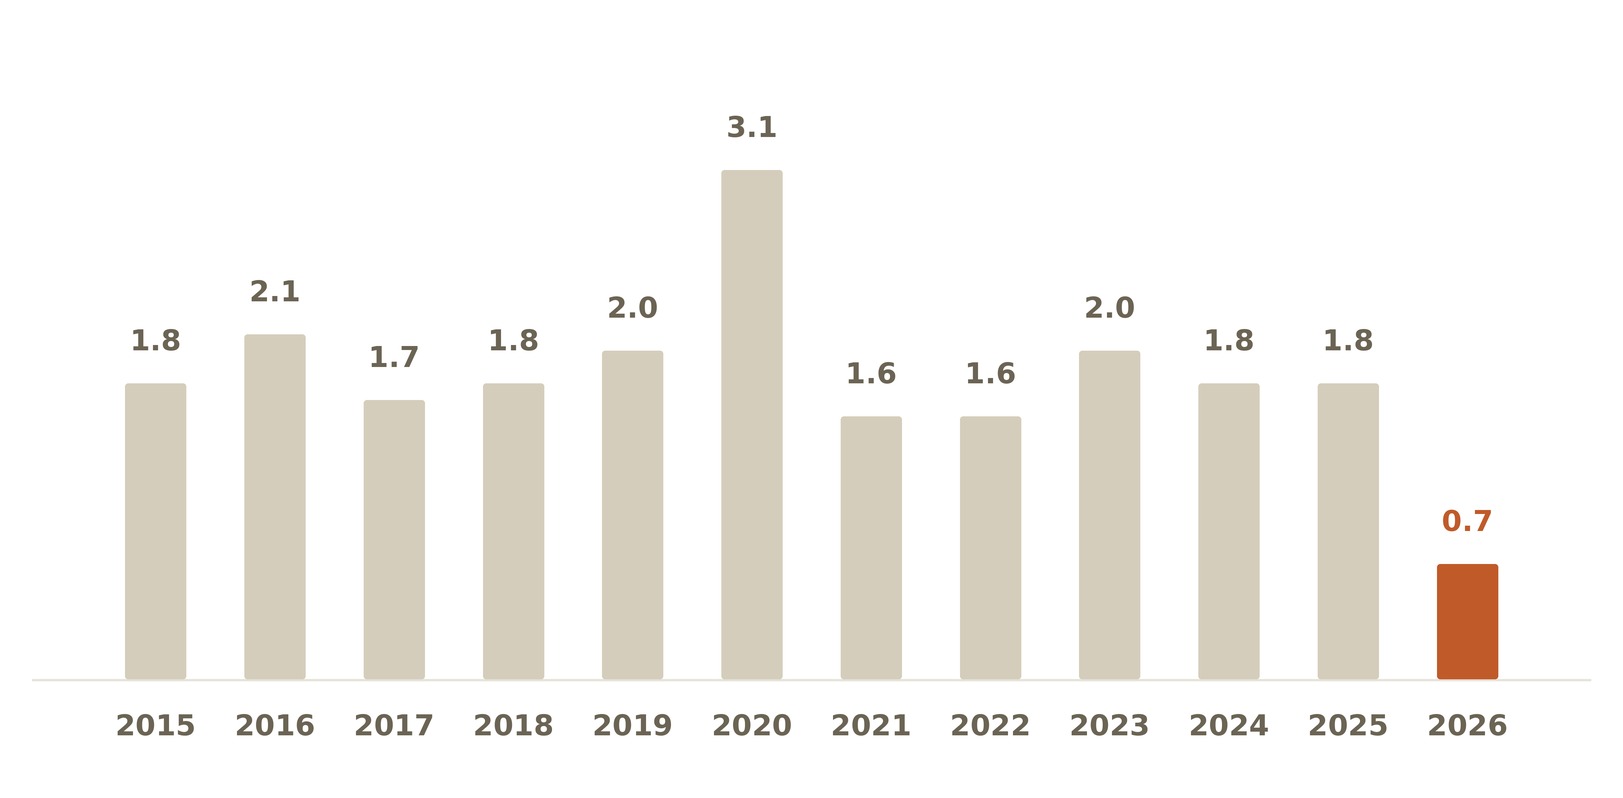
Months of supply is the cleanest way to measure that. It asks a simple question: at the current sales pace, how long would it take to sell every home on the market. In June, the answer for San Francisco houses was 0.7 months, about three weeks. That is the lowest June reading in at least twenty years, since this data begins in 2005. It is not a normal tight market. The tightest recent Junes, in the hot springs of 2021 and 2022, sat at 1.6 months, more than double where we are now. A balanced market is generally considered four to six months. Houses are running at roughly one tenth of balanced.
Not just houses
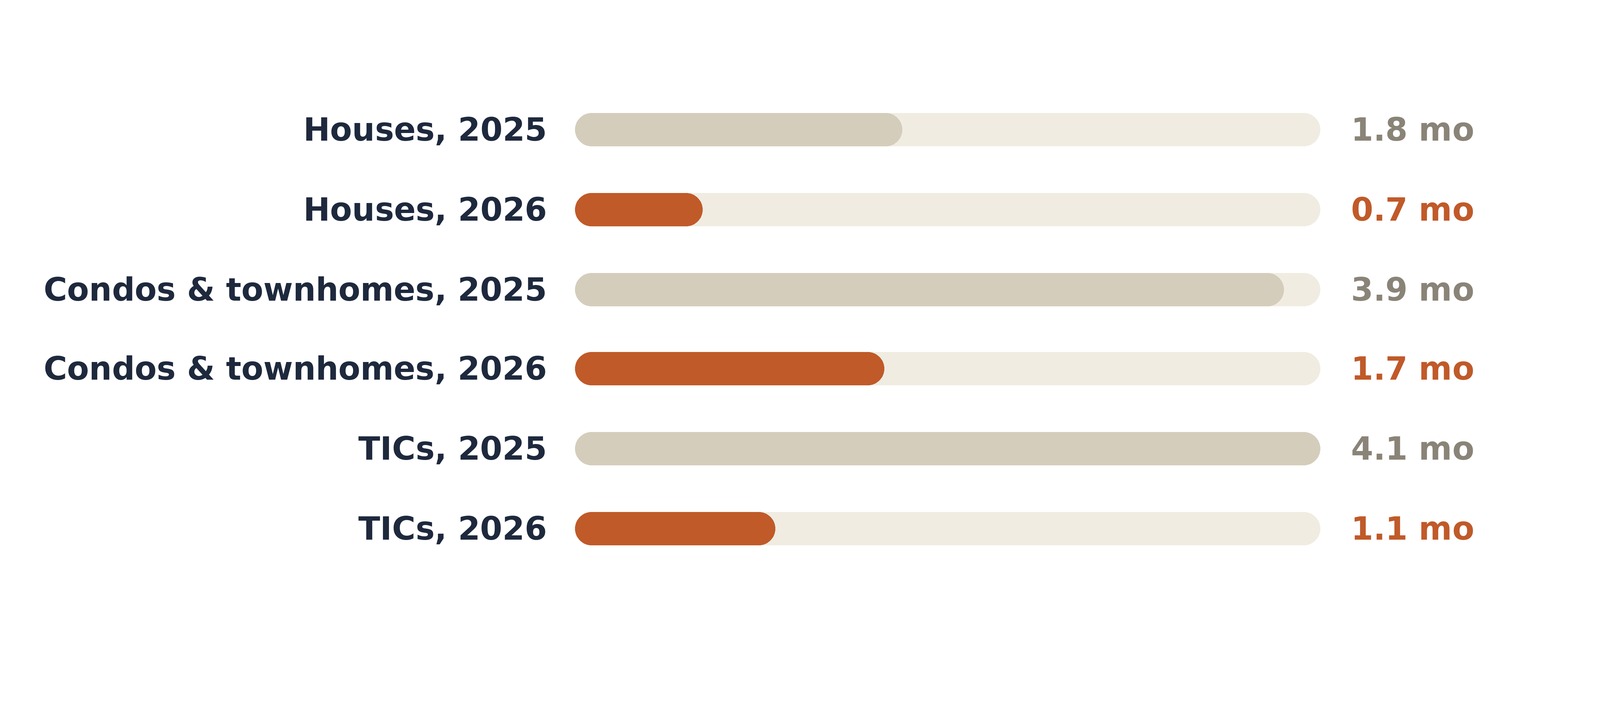
This is not a single-segment story. Condos and townhomes fell to 1.7 months of supply in June, the second-lowest June on record. TICs came in at 1.1. A year ago those same segments were at 3.9 and 4.1 months. Every property type in the city has been cut by more than half in twelve months. The drought is citywide, which is exactly why the pressure had nowhere to go but into every lane at once, the way the last issue showed.
The vanishing listings
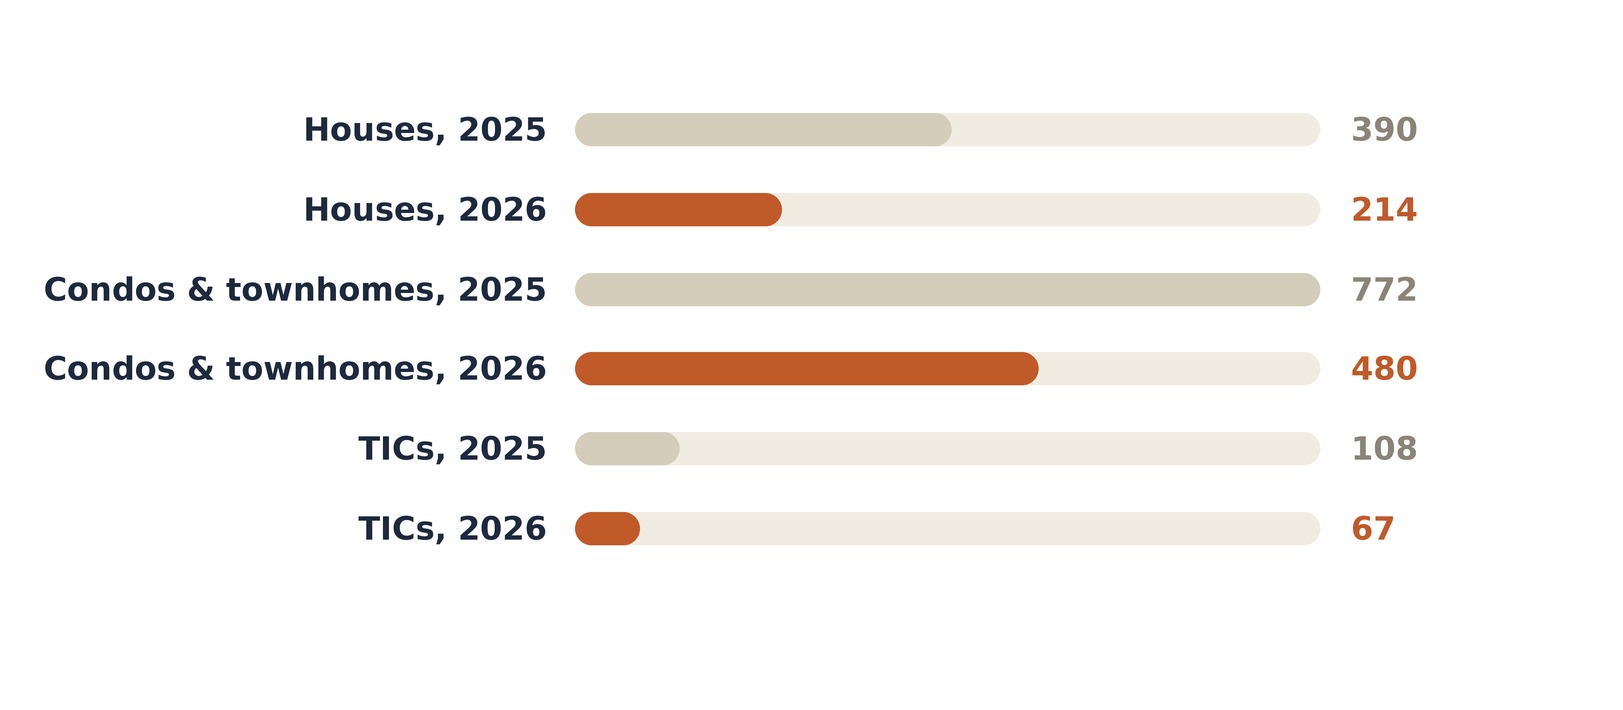
The other half of the picture is the raw count of homes for sale, and it confirms the drought is genuinely about supply, not just fast sales. This May there were 214 single-family listings active in San Francisco. A year earlier there were 390. That is 45% fewer houses to choose from. Condos and townhomes went from 772 to 480, TICs from 108 to 67, each down close to 40%. Fewer than two thirds of last year's already-thin inventory came to market this spring.
By the numbers
| Segment | Months of supply, June 2026 | A year ago | Active listings, May 2026 | A year ago |
|---|---|---|---|---|
| Houses, single-family | 0.7 | 1.8 | 214 | 390 |
| Condos and townhomes | 1.7 | 3.9 | 480 | 772 |
| Tenancy-in-common, TIC | 1.1 | 4.1 | 67 | 108 |
| Balanced market, reference | 4 to 6 | 4 to 6 |
It is not rates
The easy explanation would be interest rates, and it is worth ruling out on the record. The thirty-year mortgage is sitting near 6.5%, fed funds near 3.6%, both roughly flat over the course of this year. Money did not suddenly get cheap. If anything, rates near six and a half percent are part of why so few owners are listing: a homeowner with a low pandemic-era loan has little reason to sell into these rates and buy their next place at them. The lock-in is real. But the point for a buyer or seller today is simpler. The competition you are feeling is not a demand surge fueled by cheap money. It is a supply shortage, and it behaves differently.
What changed
0.7 mo
months of supply for houses, down from 1.8
the supply of homes for sale, cut to a twenty-year low for June
What did not
6.5%
the thirty-year mortgage, roughly flat all year
money did not get cheap; the homes simply stopped coming to market
The overbid, explained
Put the four previous issues next to this one and the whole arc resolves. When houses sell 24% over asking in eleven days, that is not crowd psychology. It is arithmetic. At 0.7 months of supply, roughly three weeks of homes on the market, any house that is priced and prepared well draws the entire active buyer pool at once, because there is no second option down the street. The overbids, the speed, the spillover into condos and TICs, all of it is what a supply drought produces. The mania was never the cause. The empty shelves were.
What to do with this
If you are selling, you are holding as much leverage as this market has offered in twenty years, and probably more than you assume. That does not mean overpricing. It means pricing to your honest comparable number and letting genuine scarcity do the work, because the buyer pool has nowhere else to go. Well-prepared homes are the ones capturing it.
If you are buying, the hard truth is that waiting for more choices has not paid off, and the data does not promise it will soon. The practical move is the one house buyers have already learned: budget from what comparable homes actually closed at, get fully underwritten before you tour, and be ready to move in days, not weeks. In a three-week market, hesitation is the most expensive thing you can do. And if you own and are not sure, this is the conversation the team is built for. Whether the right move is to sell into this scarcity, hold, or something in between depends on your specific situation, and the honest answer is sometimes to wait.
The honest caveats
Two things keep this straight. First, months of supply reflects both scarce listings and fast sales, so a low number alone could be misread. That is why the independent inventory count matters: listings are down about 40% on their own, which confirms this is a supply drought, not just quick turnover. Second, June is a single month and these are citywide medians; any block or building can run hotter or cooler. The direction, though, is unambiguous and consistent across every property type. Data deemed reliable but not guaranteed, subject to revision. General information, not legal, tax, or financial advice.
The story of 2026 has not really been about prices, or bidding wars, or buyer psychology. Under all of it is a simpler fact: San Francisco stopped listing homes. Until that changes, the frenzy is not a mood that will pass. It is the math of an empty shelf. The question worth watching now is whether fall brings the listings back. Paulo will be tracking it, and if you own, are shopping, or are weighing a move, that is exactly the conversation the team is here for.
AI Corridor Scoreboard
One reading per issue on the city's softest segment, the condos near the new AI offices, so you can watch the turn as it happens.
| Issue | Date | Reading | Call |
|---|---|---|---|
| #01 | Jun 7, 2026 | Soft. Only 37 to 43% of SoMa, Mission Bay, and downtown condos sold over asking. | Clearest buyer opportunity in the city. |
| #02 | Jun 10, 2026 | Turning at the edges. Citywide condos hit 101.4% of list in May; inventory fell to 584 from 905. The corridor towers remain the soft end. | Window narrowing, not closed. |
| #03 | Jun 13, 2026 | Still the bottom of the overbid table. Corridor sale-to-list at about 98 to 99% versus 103.6% citywide, trailing year. | Opportunity intact for negotiators. |
| #04 | Jun 17, 2026 | Still the soft floor while houses raced ahead. Corridor near 98 to 99% of list versus 103.8% citywide and about 123% for single-family in the last 30 days. | Buyer opportunity holds; the gap to houses only widened. |
| #05 | Jun 21, 2026 | Cash, not heat. Corridor condos carry heavier cash than the citywide condo average, about 42% versus 37%, yet still sell near 98.7% of list with only about 20% over asking versus 45% citywide. Cash concentrates here; competition does not. | Negotiating room for financed buyers. |
| #06 | Jun 25, 2026 | Still the calm corner while the house middle runs hot. District 9 condos, SoMa, Mission Bay, and South Beach, sold right at list, about 100%, with only 35% over asking on 300 sales, against the $1.5M to $3M house band at 122 to 125% of list. | Buyer opportunity holds where the bidding wars are not. |
| #08 | Jul 5, 2026 | Still the soft floor even as the top books records. District 9 condos, SoMa, Mission Bay, and South Beach, sold near 100% of list with heavy cash and light competition, while $5M+ houses set a decade volume record at about 112% of list on roughly 64% cash. Cash without a crowd here. | Buyer opportunity intact where the crowds are not. |
| #09 | Jul 10, 2026 | Still the soft floor at the halfway mark. District 9 condos, SoMa, Mission Bay, and South Beach, sold near 100% of list with only about 36% over asking on roughly 290 sales this year, while citywide houses ran near 121% of list. The widest lane in the city stays open. | Clearest buyer opportunity holds into the second half. |
| #10 | Jul 14, 2026 | Still soft while the headline is elsewhere. June's million-over-asking story is a west-side and central house market, not the AI-corridor towers. District 9 condos, SoMa, Mission Bay and South Beach, ran about 10% below last year even as volume climbed. Activity returns to the corridor; pricing has not. | Still the clearest buyer opening in the city. |
| #11 | Jul 17, 2026 | Unmoved by the house story. While overbidding ran one tier below the trophy core, the corridor and condo core cleared near asking, and the two flat lanes the field named as spillover candidates, Hayes Valley and Lower Pacific Heights, stayed calm in closed data. | Still the clearest buyer opening in the city. |
| #12 | Jul 21, 2026 | Still the calm corner, and it proves the point. District 9 condos, SoMa, Mission Bay, and South Beach, sold right at list, about 100%, with only 31% over asking on 836 sales, while mid-priced houses cleared 123 to 127% of list. Condos rarely get listed low to start a war, so the overbid never appears. | Buyer leverage holds where the list-low tactic is not used. |
| #13 | Jul 25, 2026 | Graduated to the essay. Back at asking for the first time since 2022, after three springs about 1% below it, and the clock changed: median market time fell from 38 days to 19 and the share selling over asking roughly doubled, from the low twenties to the mid forties. Price at par, speed doubled. | Negotiating room intact; the window now narrows in speed, not price. |
| #14 (this issue) | Jul 29, 2026 | Read on supply this time, not price. Citywide condo and townhome months of supply fell from 3.9 to 1.7 in a year and active listings from 772 to 480, so even the calmest lane in the city now offers less to choose from. This issue did not re-measure corridor pricing. | Buyer opening holds on price; the shelf behind it is thinner. |
- Houses fell to 0.7 months of supply in June, about three weeks of homes on the market and the lowest reading for any June in at least twenty years. The tightest recent Junes, 2021 and 2022, sat at 1.6, more than double where we are now. A balanced market is four to six months.
- It is not just houses. Condos and townhomes fell to 1.7 months, TICs to 1.1, and even the citywide condo number was cut by more than half in a year. Active listings are down about 40% across every property type, which confirms this is a genuine supply shortage and not just fast sales.
- It is not rates. The thirty-year mortgage has sat near 6.5% all year, and fed funds near 3.6%. Money did not get cheap. If anything, rates near six and a half percent are part of why owners are not listing: trading a low pandemic loan for this one keeps most of them put.
- So the bidding wars are arithmetic, not mania. At three weeks of supply, any home that is priced and prepared well draws the whole active buyer pool at once, because there is no second option down the street. The overbids, the speed, and the spillover into condos and TICs are what a drought produces.
- If you are selling, you hold as much leverage as this market has offered in twenty years, so price to your honest comparable and let scarcity do the work. If you are buying, waiting for more choices has not paid off, so get fully underwritten and be ready to move. And if you are not sure, sometimes the honest answer is to wait.
Every lane in this issue is live in the market explorer. Switch the property type and read the supply picture for your own neighborhood.
Sources and further reading
- Freddie Mac Primary Mortgage Market Survey, the weekly mortgage rate benchmark
- Selling in San Francisco, starting with whether you should
- How we help buyers
- Issue #13: The Pressure Valve, where the pressure went
Methodology and sources
Source: POTM Command governed MLS analytics, refreshed July 26, 2026. Months of supply and active-listing series are computed monthly for San Francisco County, single-family, condominium and townhome, and tenancy-in-common segments, back to January 2005. Months of supply is active inventory divided by the trailing monthly sales pace. June 2026 is the latest complete month for supply; active-listing comparisons use May, the latest complete month in that series. Two things keep this honest. First, a low months-of-supply figure can reflect scarce listings or simply fast sales, so the independent active-listing count matters: listings are down about 40% on their own, which confirms a supply shortage rather than a mirage of quick turnover. Second, June is a single month and these are citywide medians, so any block or building can run hotter or cooler. The direction is the same across every property type. Rate figures are from FRED: thirty-year fixed mortgage (MORTGAGE30US) and federal funds rate (FEDFUNDS), latest observations late July 2026. Data deemed reliable but not guaranteed, subject to change, correction, and revision. General information, not legal, tax, or financial advice.

About the author
Paulo Serna
Paulo is a real estate agent with Level Up Group at Compass and the team member who researches and writes each Market Intel issue. He built POTM, the governed MLS data engine behind this blog and the team’s market tools, and he lives and works in San Francisco’s Central Richmond. CA DRE# 02150409. More from Paulo at pauloserna.com.
What does this market mean for your block?
Two homes five blocks apart can carry very different risk. Ask the Level Up Group team how this read applies to your specific situation, no pressure.